initial public offerings (IPOs) trading on American exchanges

Wednesday, August 29, 2018

BJ's Wholesale Club (BJ) reported earnings on Tue 28 August 2018 (b/o)

** charts 1 day after earnings **


WESTBOROUGH, Mass. (AP) _ BJ's Wholesale Club Holdings Inc. (BJ) on Tuesday reported a loss of $5.6 million in its fiscal second quarter.
On a per-share basis, the Westborough, Massachusetts-based company said it had a loss of 5 cents. Earnings, adjusted for stock option expense and non-recurring costs, were 31 cents per share.
The results exceeded Wall Street expectations. The average estimate of eight analysts surveyed by Zacks Investment Research was for earnings of 27 cents per share.
The wholesale membership warehouse operator posted revenue of $3.31 billion in the period, also beating Street forecasts. Six analysts surveyed by Zacks expected $3.28 billion.
BJ's expects full-year earnings in the range of $1.17 to $1.24 per share, with revenue in the range of $12.6 billion to $12.7 billion.

Tuesday, August 28, 2018

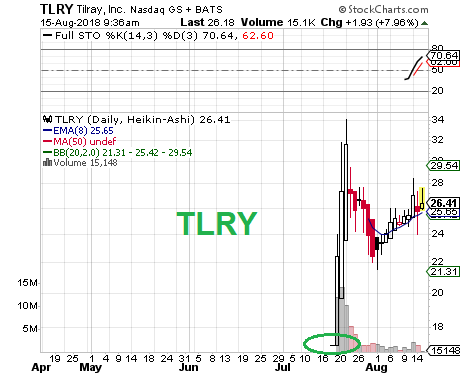
Tilray (TLRY) reported earnings on Tue 28 August 2018 (a/h)

** charts before earnings ** 


** charts after earnings **


  • 2 weeks later


Tilray reports Q2 (Jun) results 
  • Reports Q2 (Jun) GAAP loss of $0.17 per share ($2.4M), including $5.6M in stock compensatinn charges, may not be comparable to the single analyst estimate of ($0.09); revenues rose 94.0% year/year to $9.7 mln vs the $9.01 mln S&P Capital IQ Consensus, driven by increased patient demand in Canada, sales to other Licensed Producers and international sales. Total kilogram equivalents sold increased 745 kilograms to 1,514 kilograms, or 97%, compared to the prior year. Average net selling price per gram increased from $6.20 to $6.38 YoY. The increase was primarily due to growth in higher potency product and extract sales, partially offset by an increase in wholesale revenues.

Thursday, August 23, 2018

LexinFintech (LX) reported earnings on Thu 23 Aug 18 (b/o)

LexinFintech Holdings Ltd., through its subsidiaries, operates as an online consumer finance platform for young adults in the People's Republic of China.
  • Sector: Financial Services
  • Industry: Credit Services
  • Full Time Employees: 2,518
  • Founded in 2013
  • Headquartered in Shenzhen, China
  • http://www.fenqile.com
** charts after earnings **


LexinFintech Holdings (NASDAQ:LX) jumps 13% in premarket trading after the Chinese online consumer finance company posts Q2 total operating revenue of $269.5M, beating consensus by $17.1M.

Q2 total loan originations RMB 16.6B, up 68% from a year ago.

Q2 non-GAAP EBIT RMB 353.4M ($53.4M) vs. RMB 210.8M in Q1 and RMB 79.8M a year ago.

Q2 adjusted net income RMB 502.3M ($75.9M) vs. RMB 173.7M in Q1 and RMB 57.3M a year ago.

Sees FY2018 total loan origination of RMB 65B-RMB 75B, compared with RMB 80B guidance given on May 21. The Chinese government's recent actions to reduce financial risks have tightened liquidity in the P2P market, which has led to smaller players’ exiting from the industry, the company says.

Tuesday, August 14, 2018

YogaWorks (YOGA) reported earnings on Tue 14 Aug 2018 (a/h)

ticker: YOGA

** charts 
after earnings **


LOS ANGELES, Aug. 14, 2018 (GLOBE NEWSWIRE) -- YogaWorks, Inc. (YOGA) (the “Company”), one of the largest providers of high quality yoga instruction in the U.S., today announced financial results for the second quarter ended June 30, 2018.
Rosanna McCollough, President and Chief Executive Officer of YogaWorks, stated, “Our second quarter revenue exceeded our expectations mainly due to newly acquired studios.  While our EBITDA was within our guidance range, we have experienced softness in our base studio EBITDA margin.  Looking ahead, we are taking steps to improve sales and profitability in our base business and will be investing in additional marketing and training as well as reducing the class package promotions to focus on a more balanced product offering.
About YogaWorks, Inc.
YogaWorks, Inc. is one of the largest providers of high quality yoga instruction in the U.S., with 71 studios in nine markets including Los Angeles, Orange County, Northern California, New York City, Boston, Baltimore, the Washington, D.C. area, Houston and Atlanta. YogaWorks strives to make yoga accessible to everybody and offers a wide range of class styles for people of all ages and abilities. Through its studios, the Company offers yoga classes, integrated fitness classes, workshops, teacher training programs and yoga-related retail merchandise. In addition to its studio locations, YogaWorks offers online instruction through its MyYogaWorks web platform, which provides subscribers with a highly curated catalog of over 1,100 yoga and meditation classes.

Casa Systems (CASA) reported earnings on Tue 14 Aug 2018 (a/h)

** charts before earnings **


** charts after earnings **


Casa Systems beats by $0.01, misses on revs; guides FY18 EPS below consensus, revs below consensus, announces $75 mln stock repurchase program 
  • Reports Q2 (Jun) earnings of $0.24 per share, $0.01 better thanthe Capital IQ Consensus of $0.23; revenues rose 3.2% year/year to $68.7 mln vs the $90.64 mln Capital IQ Consensus.
  • Reports gross margin of 71.9%, compared to gross margin of 68.7% in 2Q17.
  • Co issues downside guidance for FY18, sees EPS of $0.80-$0.88 vs. $1.14 Capital IQ Consensus Estimate; sees FY18 revs of $330-$350 mln vs. $390.57 mln Capital IQ Consensus Estimate.
  • Commentary: "...While we are disappointed with the moderation in our top-line growth during the second quarter, we believe that this is related to the timing of several projects involving network transformation and capacity upgrades. Given the forward pipeline in all three of our end markets, I am as enthusiastic as ever about the outlook for the company. Based on our confidence in the future of the business and commitment to delivering value to our shareholders, we are announcing a stock repurchase program for up to $75 million of shares of common stock ..."

PetIQ (PETQ) reported earnings on Tue 14 Aug 2018 (a/h)

** charts before earnings **


** charts after earnings *


PetIQ beats by $0.28, beats on revs; guides FY18 revs above consensus
  • Reports Q2 (Jun) earnings of $0.66 per share, $0.28 better than the Capital IQ Consensus of $0.38; revenues rose 96.2% year/year to $171.1 mln vs the $148.48 mln Capital IQ Consensus.
  • Adjusted gross profit was $28.1 million and adjusted gross margin was 16.4% for 2Q18.
  • PETQ opened 17 wellness centers and three regional offices during the quarter, for a total of 29 wellness centers and 34 regional offices in operation as of quarter-end with all 20 VetIQ wellness centers currently open.
  • Co issues upside guidancefor FY18, sees FY18 revs of $500.0 mln vs. $481.45 mln Capital IQ Consensus Estimate. Co reaffirms Adj EBITDA guidance of $40-$45 mln.

Thursday, August 9, 2018

TrueCar (TRUE) reported earnings on Thur 9 Aug 2018 (a/h)

** charts after earnings **


TrueCar reports EPS in-line, revs in-line; guides Q3 revs in-line; guides FY18 revs in-line 
  • Reports Q2 (Jun) earnings of $0.03 per share, excluding non-recurring items, in-line with the Capital IQ Consensus of $0.03; revenues rose 7.4% year/year to $87.85 mln vs the $87.81 mln Capital IQ Consensus.
    • Units were 250,269 in Q2, up 3% from 242,130 in 2Q17.
  • Co issues in-line guidance for Q3, sees Q3 revs of $93-95 mln vs. $94.58 mln Capital IQ Consensus Estimate.
  • Co issues in-line guidance for FY18, sees FY18 revs of $360-365 mln vs. $361.28 mln Capital IQ Consensus Estimate. Units are expected to be in the range of 1,030,000 to 1,040,000.

Vista Outdoor (VSTO) reported earnings on Thur 9 Aug 2018 (b/o)

** charts after earnings **


Vista Outdoor beats by $0.11, misses on revs; guides FY19 EPS in-line, revs below consensus 
  • Reports Q1 (Jun) net of breakeven, excluding non-recurring items, $0.11 better thanthe Capital IQ Consensus of ($0.11); revenues fell 7.0% year/year to $528.84 mln vs the $542.54 mln Capital IQ Consensus.
  • Co issues guidancefor FY19, sees EPS of $0.15-0.35, excluding non-recurring items, vs. $0.22 Capital IQ Consensus Estimate; sees FY19 revs of $2.1-2.16 bln vs. $2.25 bln Capital IQ Consensus Estimate.
    • Capital expenditures of approximately $60 million
    • Free cash flow in a range of $70 million to $100 million, compared to previous free cash flow guidance in a range of $55 million to $85 million
    • The company also expects FY19 EBITDA margins in a range of approximately 7.5 percent to 8 percent.

CareDx Inc. (CDNA) reported earnings on Thur 9 Aug 2018 (a/h)

** charts before earnings **


** charts after earnings **


BRISBANE, Calif. (AP) _ CareDx Inc. (CDNA) on Thursday reported a loss of $14.1 million in its second quarter.
On a per-share basis, the Brisbane, California-based company said it had a loss of 40 cents. Losses, adjusted for non-recurring costs and stock option expense, were 4 cents per share.
The molecular diagnostics company posted revenue of $17.8 million in the period.
CareDx expects full-year revenue in the range of $68 million to $70 million.
CareDx shares have more than doubled since the beginning of the year. In the final minutes of trading on Thursday, shares hit $14.97, climbing tenfold in the last 12 months.